SVG Diagrams
Turn a process into a clear, editable diagram.
Input
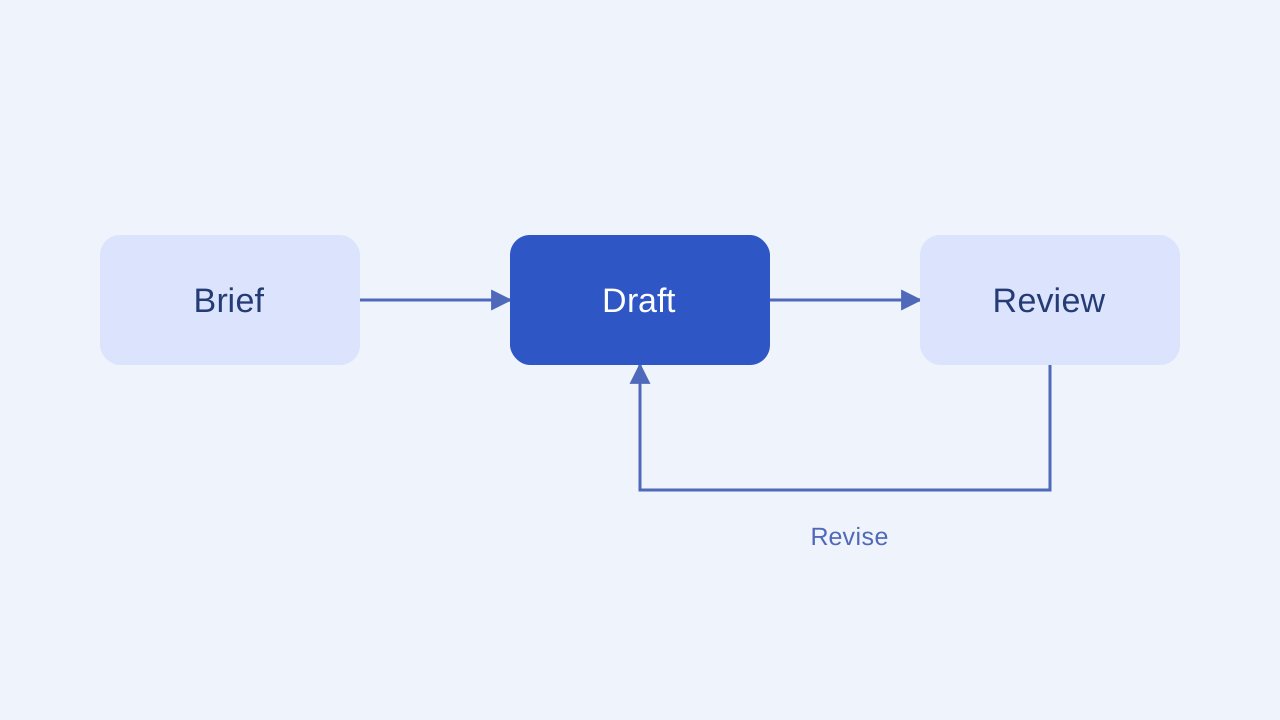
Brief leads to Draft, then Review. A Revise loop returns from Review to Draft. Use blue rounded nodes on a pale background.
Instructions
Paste into your AI assistant, or install for reuse.
Manual download
Download .mdView instructions
---
name: svg-diagrams
description: Turn described processes and relationships into clear, self-contained SVG flowcharts and system diagrams.
---
# SVG Diagrams
Translate supplied relationships into a readable static vector diagram.

## Model before drawing
- Extract nodes, directed relationships, and branch conditions from the user's description. Do not invent steps or imply that correlation is causation.
- Distinguish sequence, containment, and dependency. Choose a consistent visual meaning for each connector style.
- For uncertain relationships, ask one focused question or mark the relationship as unconfirmed. Do not silently pick a direction.

## Draw
- Use the requested dimensions or a landscape viewBox. Measure the longest labels before choosing node sizes, and allow at least 16 pixels of text padding.
- Align primary steps along one axis. Route feedback loops outside the main row, leaving clear space for labels and arrowheads.
- Make arrowheads end at node boundaries rather than underneath nodes. Label branch conditions near the relevant connector without overlapping other labels.
- Use a small palette and make the diagram understandable without relying on color alone. Prefer a few readable nodes to a dense graph squeezed onto one page.
- Export editable SVG with an accessible title and description, explicit width and height, and a viewBox. Escape text in XML. Use no scripts, remote resources, or HTML foreignObject elements.

## Check
Verify every source node and edge appears exactly as intended. Check arrow direction, branch labels, dangling connectors, text bounds, and overlaps in a rendered preview when possible. If you cannot render, distinguish structural checks from unperformed visual checks.

## Deliver
Write diagram.svg in a new output folder, plus a brief node-and-edge list so the relationships can be reviewed. Do not claim the depicted system was implemented or tested merely because a diagram was drawn.
Output
Generated with GPT-6Download example SVG
How to use
Choose Install, run the command in your project folder, and select your AI tool. Alternatively, copy the instructions into your coding assistant, then describe what you want to make. Open the resulting SVG in a browser or vector editor. Your AI assistant may have its own usage costs.
Remove private information and check the result before using it.
Tips & limitations
Describe each step and relationship, including the direction of any feedback loops.
Match all nodes, labels, and arrow directions to your source description.
Creates a static diagram. It does not implement or test the process shown.
More examples
Input
Brief leads to Draft, then Review. A Revise loop returns from Review to Draft. Use blue rounded nodes on a pale background.
Output
An editable flowchart with a labeled feedback loop.
When information is missing
Input
Connect two steps without specifying which comes first.
Output
Ask for the direction or mark the relationship as unconfirmed.